NEW Research Reports: MEMORIAL DAY SALE
NEW: Bull Market Model Book
Deep Dives into Data, Charts & Stats for Bull Markets
- Bull Climax Tops
Bull Distribution Tops - Characteristics to Observe at Tops
- Bull Super Cycle & Targets
- Bull Market Cycle Signposts
- Tools for Identifying Tops
- Power Trend Data 1978- 2025
- Psychology & Sentiment
- Eureka & Zweig Breadth Thrusts
- Market Summary Data 1900 – 2025
- Over 75 Charts
- 21 Graphic Data Tables
- 140 Page PDF
Premium Report: $149
Use Code at Checkout: Report25 for 25% OFF
NEW: Bear Market Model Book

Characteristics and Data surrounding Bear Market and Bull Corrections
- Selling Climax Bottoms
Selling Dry Up Bottoms - Characteristics to Observe at Bottoms
- 7 Major Bear Markets & FTD Data
- Bear Market Failed Rally Data
- FTD #1 Failure Data
- Vertical Violation Data Table
- 26 Bull Market Corrections Data
- 37 Annotated Charts of Emerging New Leaders at Market Bottoms
- Over 75 Charts
- 20 Graphic Data Tables
- 141 Page PDF
Premium Report : $149
Use Code at Checkout: Report25 for 25% OFF
NEW: Both Bull - Bear Data

Get both Bull & Bear Model Books in one complete report with all the Data & Charts
- Bull Market Model Book
- Bear Market Model Book
- 40 Data Tables
- 150 Charts
- 281 Page PDF
Premium Report: $249
Use Code at Checkout: Report25 for 25% OFF
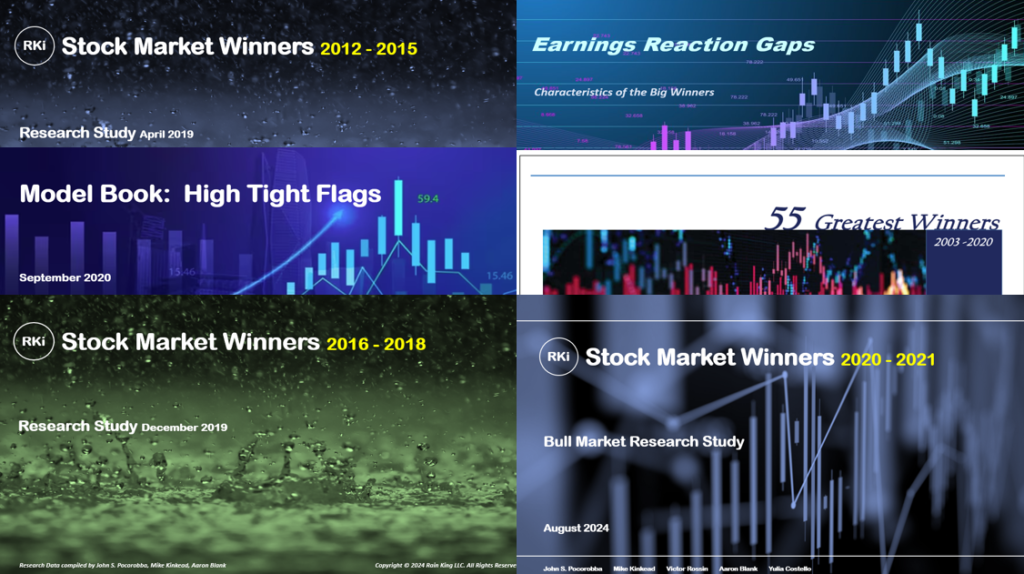
Stock Market Winners 2020 - 2021 Original Price $795 is now $399

The Covid Bear Market and Recovery was a unique period in market history.
- Groundbreaking Research on “Green Flag Stocks” surging 20% in 3wks post breakout. Learn the edge knowing “True” Green Flag vs “Soft” Green Flag Stocks
- Over 100 professionally annotated Daily and Weekly charts
- Purchase includes 300 page report and 3 Recorded Webinars explaining the key insights.
Premium Report with 3 Webinars: $399
Stock Market Winners 2016 - 2018

Bull Mkt launched in 2016 creating big winners such as Nvidia, Shopify, Square, Novacure, and Weibo.
- Deep dive into the FTD Analysis and the Initial Breakout Run
- Graphic Summary charts, Tables and Data Comparisons to the 2012-’15 Market Cycle.
- Research Summary Insights
- 28 Professional Annotated daily, weekly charts of the Big Winners
- WOO Rules and Screens
Premium Report: $199
55 Greatest Winners 2003 - 2020
Model Book of the “Best of the Best’.
55 Winners from 2003 – 2020.
- Base Analysis, the Breakout, 10 week Moving Ave. Breaks and the Topping signals
- All 55 stocks are professionally annotated on daily and weekly charts.
- Must own Model Book for any serious trader’s library!
Premium Report: $199
High Tight Flags
High Tight Flags are rare but one of the most powerful of setups. Each Bull Market features a few of these rare gems.
- Catalogs 54 High Tight Flags on Daily and Weekly charts
- Research Summary Insights
- Key characteristics of the pole, the flag measurements, base data, prior uptrends, dormancy periods and extreme volume dry-ups
- 34 Professionally Annotated Charts
Report: $99
Stock Market Winners 2012 - 2015

Late 2012 launched a powerful bull market led by big winners including Tesla, Micron Tech, 3D Systems, Skyworks, Sketchers and Netflix.
- Research Summary Insights
- Winners Template of signposts
- Gains by Base Type, FTD Analysis and Key Fundamental Data
- 15 Graphic Summary Charts
- Bear Market Cycle Statistics including FTD success and failure data
- 12 Annotated Weekly Charts
- Bonus: Comparison Data to 2009-’11 Bull Cycle
Premium Report: $199
Earnings Reaction Gap Course
Scared by Big Earning Gaps Ups? This 2016 – ’20 research study found the key characteristics of Earnings Gappers with special attention to Power Earnings Gaps and Monster Gaps.
- This Report is the foundation for a complete 17 hour ERX Gap Workshop Course
- Course includes Buy Strategies for Day, Swing and Positions traders
- If interested in Full Course, please email support@rainkinginsights.com
Earnings Preparation Calls
Every Quarter we prep investors for the next Earning Season. We identify potential growth stock for Earning Reaction Gap Opportunities.
- We use all the techniques from our 17 hour ERx Gap Workshop Course
- We identify all the key levels to watch for entries, add-ons and how to manage risk
- Our backtested research on greatest ERx Gap Ups identify the key levels for entries, add-ons and how to manamge risk. Put the odds in your favor!
- If interested in ERx Prep Calls, please email support@rainkinginsights.com
Triple Play Bundle
Bundle any three reports to save 20-25%.
- Please email inquiries with specific reports to jpoco@rainkinginsights.com
- Coupons cannot be used with this offer.