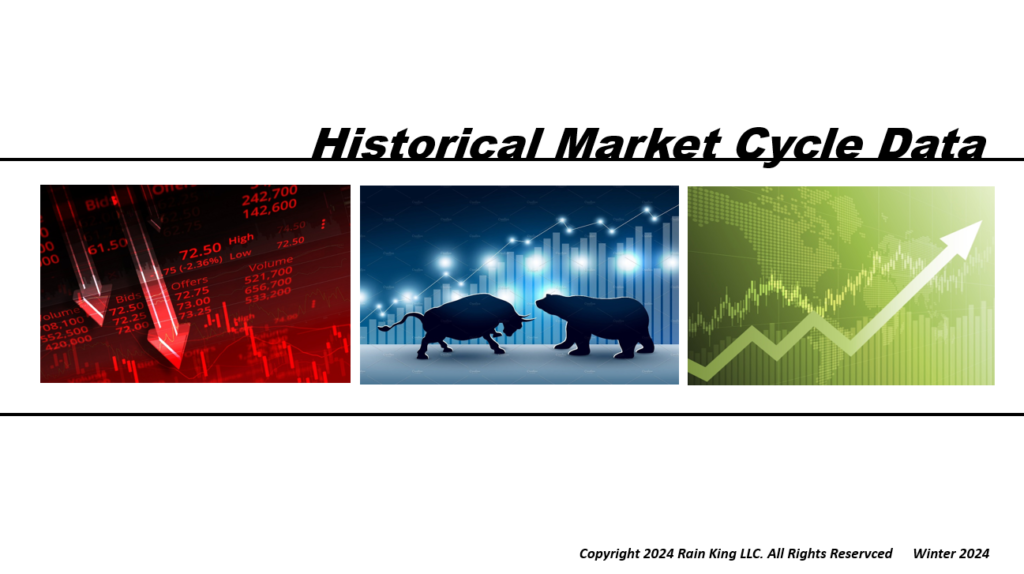
COMING SOON: Observing the Market Series
Series goes ‘under the hood’ to examining the tools and techniques Rain King utilizes to observe and interpret Market Action including Market Breadth, Trend and Sentiment combined with historical view of the different types of Market Tops and Bottoms
Market Cycle vs Economic Cycle

Market Breadth

Market Trend

The Stock Market is a discounting mechanism looking ahead six to nine months. It can be a leading indicator of the Economic Cycle
Market Internals, or Breadth give us a look at the health of the general market. New Highs/New Lows, Advance-Decline Line etc. can provide a good read whether to be aggressive or cautious in the current market environment
While catching Market Tops and Bottoms are not necessary, we do need solid method to evaluate and monitor Market Trend to make investing progress.
Market Sentiment

Market Distribution Tops

Market Climax Tops

The markets represent the net aggregate opinion of all market participants. When sentiment reaches extremes it can be helpful tool as a tertiary indicator.
Market Tops come a two major flavors. In this video we examine historical markets and discuss examples of Distribution Tops such as 1973, 1990, 1990, 2007, 2018 and 2020.
Some Market Tops are driven by greed and a made rush to the ultimate top before rolling over. This video examines historical markets using examples of Climax Tops such as 1929, 1987 and 2000.
Market Climax Bottoms

Market Extended Bottoms

xxxxx

Market Bottoms can be dramatic and lead to selling capitulation driven by extreme fear and a rush to the exits. We breakdown some climax bottoms from history including 1962, 1987, 1998 2016 and 2018.
Some Market Bottoms are marked by grinding extended downtrend measured in years, not months. Brief Rallies, numerous failed FTDs and the eventually dry up selling can mark the Bottom. Examples include 1932, 1974, 1982, 2002
xxxxxxxxxxxxxxxxxxxxxx.
